China makes about a quarter of the world's honey, and the United States buys about a third of all the honey that crosses a border. In 2024 the US imported 254,926 tonnes and produced 60,960. This page sets out, from the Food and Agriculture Organization's (FAO) statistics, who produces, sells and buys honey, what a tonne is worth by origin, and what the European Union found when it tested imported samples. Every figure links to its source, and the page says where the data have limits.
Who produces the world's honey?
FAO's crops and livestock statistics put world production of natural honey at 1,959,431 tonnes in 2023, up from 1,759,630 tonnes in 2014. China (mainland) produced 463,500 tonnes, about 24% of the world total. Türkiye (114,886 tonnes), India (105,000), Iran (78,012), Ethiopia (71,613) and Argentina (69,701) followed, and Russia, Brazil, Mexico, Ukraine and the United States each produced between about 58,000 and 65,000 tonnes. No other country comes close to China, but outside it production is spread across many countries.
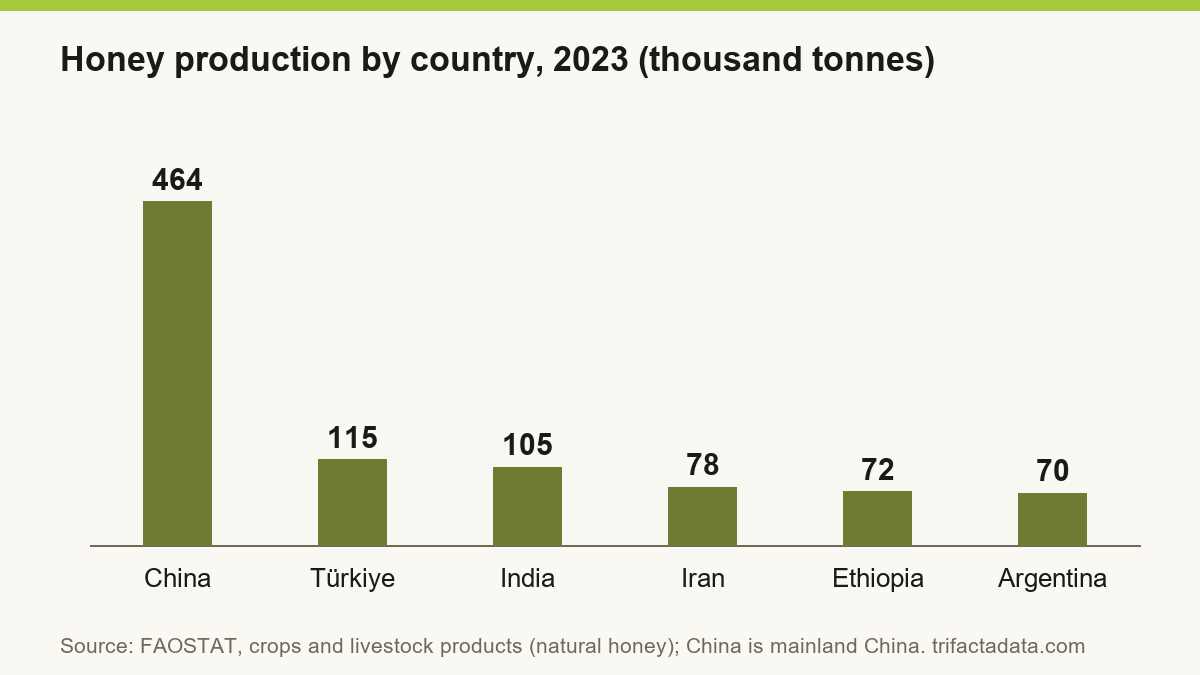
A note on the data: FAO's figures for many countries are official reports, but a share are FAO estimates or unofficial figures, and a country's latest year can be revised. The 2024 production figures in the file are still incomplete (several European countries have not yet reported), so this page uses 2023 for production and 2024 for trade, where reporting is nearly complete.
Who sells honey, and for how much?
Trade is more concentrated than production. In 2024, FAO trade data show about 827,000 tonnes of honey exported worldwide (the sum of the volumes reported by each country). China was the largest exporter with 169,573 tonnes, 20.5% of that volume, followed by India (94,778 tonnes), Ukraine (85,812), Argentina (78,375) and Viet Nam (45,359). Dividing each country's export value by its export volume gives an average declared value per tonne: USD 1,562 for China, 1,897 for India, 1,946 for Ukraine and 2,179 for Argentina, against USD 4,000 for Spain and, in 2023, USD 6,268 for Germany.
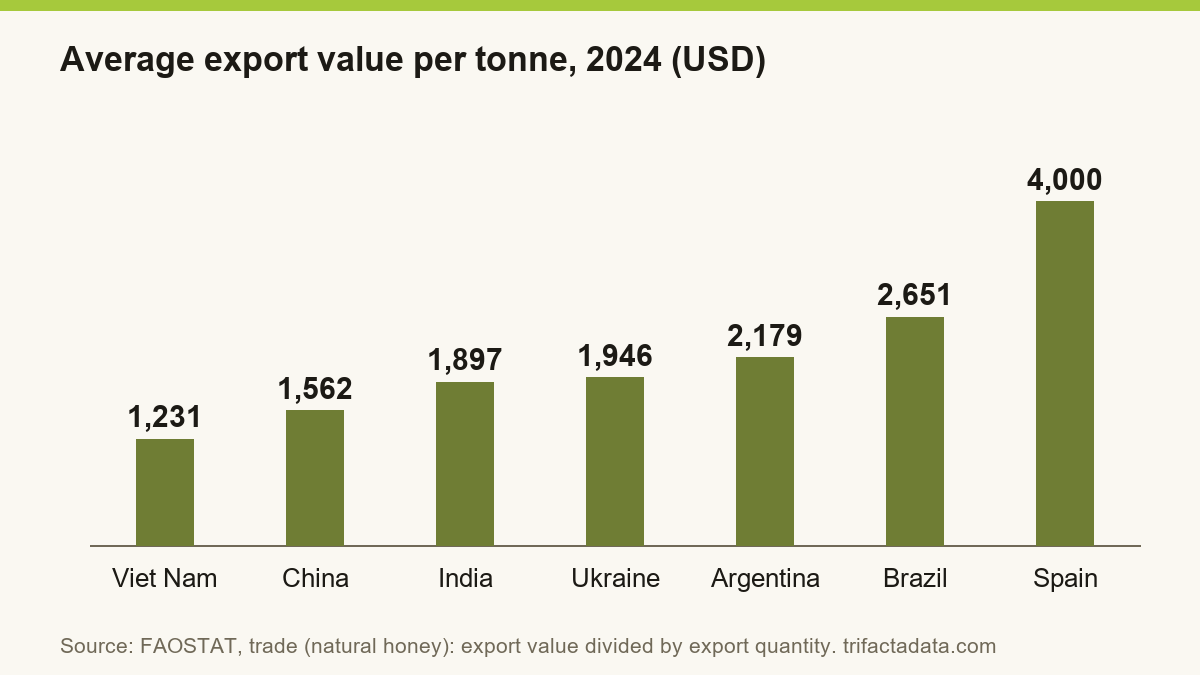
These are customs values, not retail prices, and they mix very different products. The lower figures mostly describe bulk honey in drums for packers and blenders. The higher figures from Spain and Germany include packed and blended honey, and re-exports of honey that was imported first, so they are not the price of honey from those countries' own hives. The averages show the gap between bulk and branded trade, not the price of any single product.
| Exporter, 2024 | Exports (tonnes) | Share of world export volume | Average value (USD a tonne) |
|---|---|---|---|
| China | 169,573 | 20.5% | 1,562 |
| India | 94,778 | 11.5% | 1,897 |
| Ukraine | 85,812 | 10.4% | 1,946 |
| Argentina | 78,375 | 9.5% | 2,179 |
| Viet Nam | 45,359 | 5.5% | 1,231 |
| Brazil | 37,931 | 4.6% | 2,651 |
Who buys it?
The United States is by far the largest importer. FAO trade data show US imports of 254,926 tonnes in 2024, about 31% of the volume imported worldwide. Germany (72,138 tonnes), the United Kingdom (60,305), Japan (45,416) and Belgium (37,606) came next. Because the European Union is a single market, part of what Germany and Belgium import is re-exported to other EU countries, which is why they also appear among the exporters; world trade figures count each crossing of a border.
| Importer, 2024 | Imports (tonnes) | Share of world import volume | Average value (USD a tonne) |
|---|---|---|---|
| United States | 254,926 | 31.4% | 2,551 |
| Germany | 72,138 | 8.9% | 3,142 |
| United Kingdom | 60,305 | 7.4% | 2,041 |
| Japan | 45,416 | 5.6% | 3,013 |
| Belgium | 37,606 | 4.6% | 2,163 |
The United States: imports up, production down
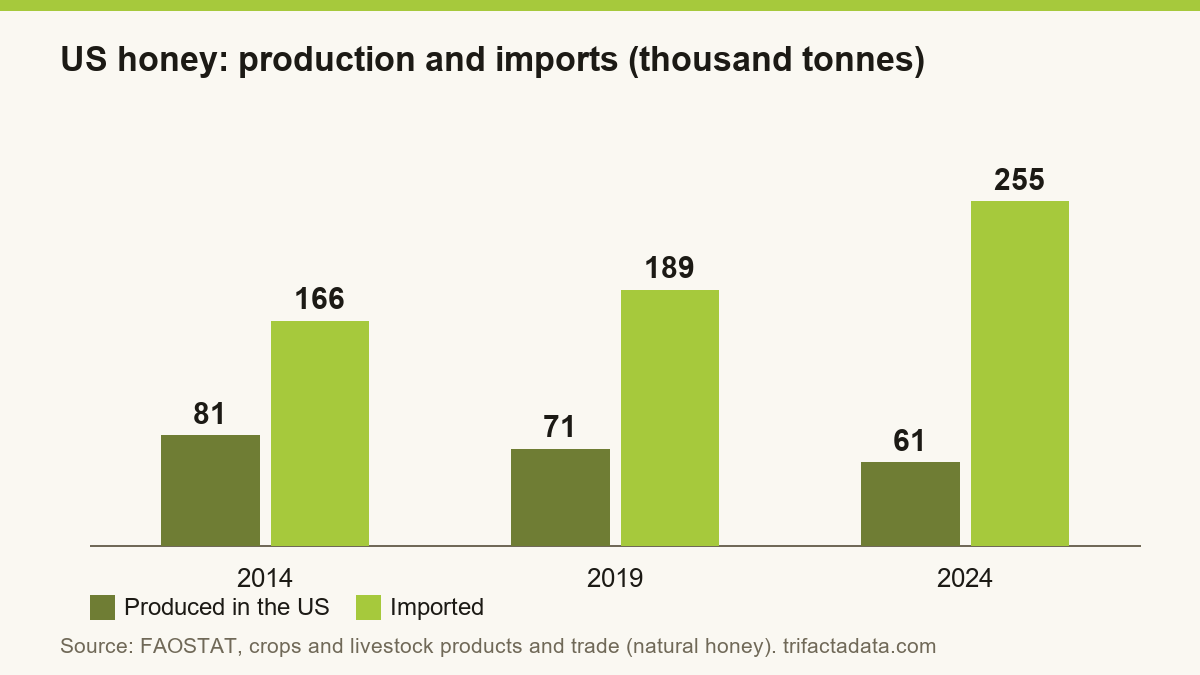
FAO data show US production fell from 80,862 tonnes in 2014 to 60,960 tonnes in 2024, while imports rose from 165,945 to 254,926 tonnes. Adding production and imports and subtracting exports gives an apparent supply (it ignores changes in stocks), of which imports were about 69% in 2014 and about 83% in 2024. Put another way, the US imported about two tonnes for each tonne it produced in 2014 and about four in 2024. The average declared import value fell over the same period, from USD 3,384 a tonne to USD 2,551. The data do not explain why, and the changes combine supply, price and the mix of origins, so they should be read as a description, not a cause.
What the EU found when it tested imported honey
Honey can be adulterated with cheaper sugar syrups, and the EU has run coordinated checks on imports. In an EU-wide check published in March 2023, the Joint Research Centre analysed 320 honey samples taken at the border between November 2021 and February 2022 and reported that 147 of them (46%) were suspected of not meeting the EU Honey Directive. "Suspected" is the Commission's word: the laboratory methods flag samples that show signs of added sugars. The result is a sample of imports checked in that period, not a measure of all honey on sale, and the number should not be applied to any single brand or country.
New origin rules in the EU
Directive (EU) 2024/1438, as described by Ireland's food safety regulator, changes the labelling of honey blends. From 14 June 2026, where honey comes from more than one country, every country of origin must appear on the label in the main field of vision, listed from the largest to the smallest share by weight, each with its percentage, with a tolerance of 5% on each share. Until then, blends can still use phrases such as "blend of EC honeys"; "filtered honey" is removed as a permitted description, and honey that was packed and labelled before 14 June 2026 can be sold until stocks run out. The Commission is also due to set methods of analysis and traceability criteria by June 2029. For buyers, the effect is that the origin mix of every blend becomes visible on the shelf.
Why scope matters when you size a honey market
The trade data show how wide the range of prices behind a "honey market" figure is. A tonne leaving Viet Nam is declared at about a quarter of the value of a tonne leaving Spain, and farm-gate, wholesale and retail values differ again. An estimate that counts bulk honey, one that counts only branded retail jars and one that adds honey-based products will give very different totals, so the scope behind a number should be checked before the number is used.
Frequently asked questions
Which country produces the most honey?
China. FAO data put mainland China's 2023 production at 463,500 tonnes, about 24% of the world total of 1.96 million tonnes. Türkiye, India, Iran, Ethiopia and Argentina follow, each producing between 70,000 and 115,000 tonnes.
Which country imports the most honey?
The United States. It imported 254,926 tonnes in 2024, about 31% of the volume imported worldwide, according to FAO trade data.
How much of the honey the US uses is imported?
FAO data give imports of about 83% of apparent US supply in 2024, up from about 69% in 2014. Apparent supply is production plus imports minus exports and ignores changes in stocks.
Is imported honey adulterated?
Some is suspected to be. In a 2021-22 EU check, 147 of 320 samples taken at the border (46%) were suspected of not meeting the EU Honey Directive, according to the European Commission's Joint Research Centre. The finding applies to the samples checked, not to all honey.
When do the EU's new honey labelling rules apply?
From 14 June 2026. Blends must list every country of origin by weight with its percentage, and honey packed and labelled before that date can be sold until stocks run out.
Sources
- FAOSTAT, crops and livestock products: natural honey, production, 1961-2024 (bulk file downloaded 11 October 2026)
- FAOSTAT, trade: natural honey, import and export quantity and value, 1961-2024 (bulk file downloaded 11 October 2026)
- European Commission Joint Research Centre, "Food fraud: how genuine is your honey?", 23 March 2023
- Food Safety Authority of Ireland, Honey legislation page (Directive (EU) 2024/1438)
- Directive (EU) 2024/1438, Official Journal of the European Union (EUR-Lex)
Related reports
This page is market information, not medical advice. Figures are quoted from the sources linked above; forecasts are labelled as such.