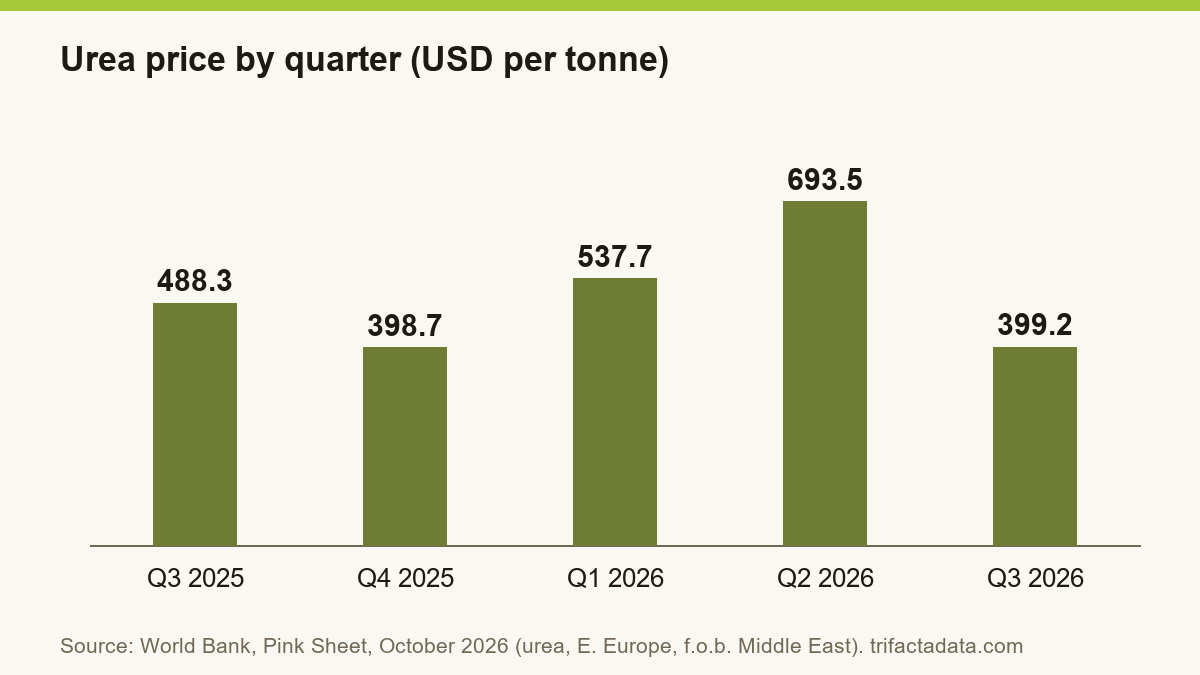
In April 2026 the World Bank forecast that urea would average USD 675 a tonne this year. The prices published in October show a different path: a first-quarter average of USD 537.7, a second-quarter average of USD 693.5 and a third-quarter average of USD 399.2, while the price of DAP, the main phosphate fertilizer, kept rising. This page sets the forecast beside the data, shows who supplies the world's nitrogen, phosphate and potash, and says what is still uncertain. Every figure links to the page it came from.
What the World Bank forecast in April
In its April 2026 Commodity Markets Outlook, the World Bank forecast that its fertilizer price index would average 181.3 in 2026 (2010 = 100), up 30.7% from 138.7 in 2025, and ease to 152.1 in 2027. For urea it forecast an average of USD 675 a tonne in 2026, up 59.7% from USD 422.7 in 2025, falling to USD 500 in 2027.
The World Bank's data blog of 14 May 2026 explained the rise. The index had gone up by more than 12% in the first quarter and by April was at its highest level since October 2022, driven mainly by export disruptions linked to the closure of the Strait of Hormuz. Urea had risen above USD 850 a tonne in April, up 80% since February, and sulfur prices had doubled since January. The blog reported that Qatar had suspended production of urea, ammonia and sulfur after damage to key facilities, that Iran had halted ammonia production, that India had cut urea and ammonia output because of lower LNG supplies, and that China had moved to tighten exports. It added that the Middle East accounts for nearly one quarter of global urea exports, and that risks to the forecast were tilted upward.
What the October data show
The World Bank's Pink Sheet of October 2026 gives prices up to September. Urea averaged USD 537.7 a tonne in the first quarter, USD 693.5 in the second and USD 399.2 in the third, and was USD 407.5 in September. The simple average of the three quarters is USD 543.5 (calculated by Trifacta Data), below the April forecast of USD 675 for the full year, although the fourth quarter is not yet known. The fertilizer index followed the same shape: 154.7, then 188.2, then 147.6, and 147.0 in September. A monthly peak, such as the USD 850 the blog reported for April, is a different measure from a quarterly average, so the two figures are not directly comparable.
The forecast was closer for other products. Over the first three quarters DAP averaged USD 728.7 a tonne against a forecast of USD 725 for the full year, potassium chloride (potash) USD 386.5 against USD 390, and phosphate rock USD 158.8 against USD 160 (all calculated by Trifacta Data; the fourth quarter is not yet known). Triple superphosphate averaged USD 649.4 against USD 625, and the index 163.5 against 181.3.
| Product, USD a tonne | 2025 | Q1 2026 | Q2 2026 | Q3 2026 | Sep 2026 | April forecast, 2026 |
|---|---|---|---|---|---|---|
| Urea (E. Europe, f.o.b. Middle East) | 422.7 | 537.7 | 693.5 | 399.2 | 407.5 | 675 |
| DAP (US Gulf) | 685.2 | 634.7 | 759.5 | 791.8 | 800.6 | 725 |
| Triple superphosphate (US Gulf) | 577.6 | 541.2 | 702.4 | 704.6 | 690.0 | 625 |
| Potassium chloride (CFR Brazil) | 347.5 | 373.0 | 402.9 | 383.6 | 367.5 | 390 |
| Phosphate rock (N. Africa) | 152.5 | 152.5 | 154.0 | 170.0 | 170.0 | 160 |
| Fertilizer price index (2010 = 100) | 138.7 | 154.7 | 188.2 | 147.6 | 147.0 | 181.3 |
Why phosphates kept rising
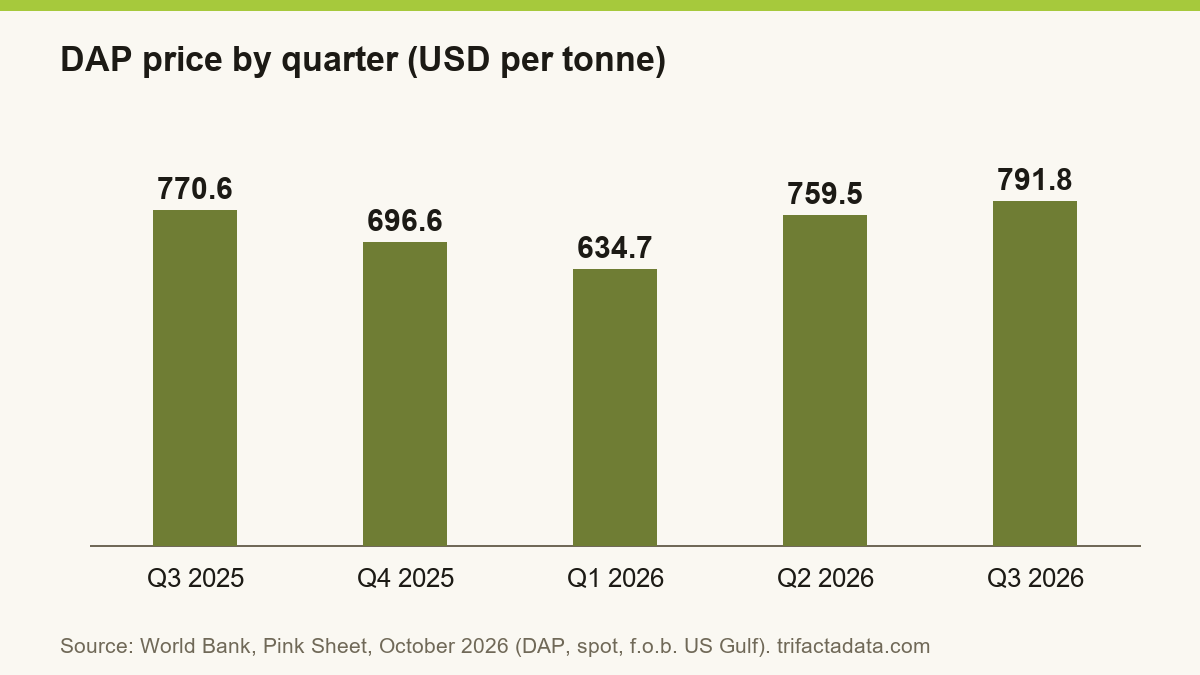
DAP rose through the year: USD 634.7 a tonne in the first quarter, USD 759.5 in the second and USD 791.8 in the third, with USD 800.6 in September, against USD 685.2 for 2025 as a whole.
The World Bank's May blog pointed to three pressures on phosphates: sulfur, which it said had doubled in price since January; Chinese moves to tighten fertilizer exports, which it said added upward pressure on DAP; and Morocco's OCP accelerating maintenance at its phosphate facilities. The blog did not explain why urea later fell back, and the data above do not either. The US Geological Survey adds that turning phosphate rock into fertilizer needs sulfur, that contract sulfur prices at Tampa had already risen from USD 116 per long ton at the start of 2025 to USD 310 in early October 2025, and that the fourth-quarter 2025 prices were the highest since the second quarter of 2022.
Looking ahead, the April forecast had DAP falling by about 10% in 2027 as new capacity arrives, and the USGS expects world phosphate production capacity to rise from 63.7 million tonnes of P2O5 in 2025 to 71.7 million by 2029. Both are forecasts.
Who supplies the world's nutrients
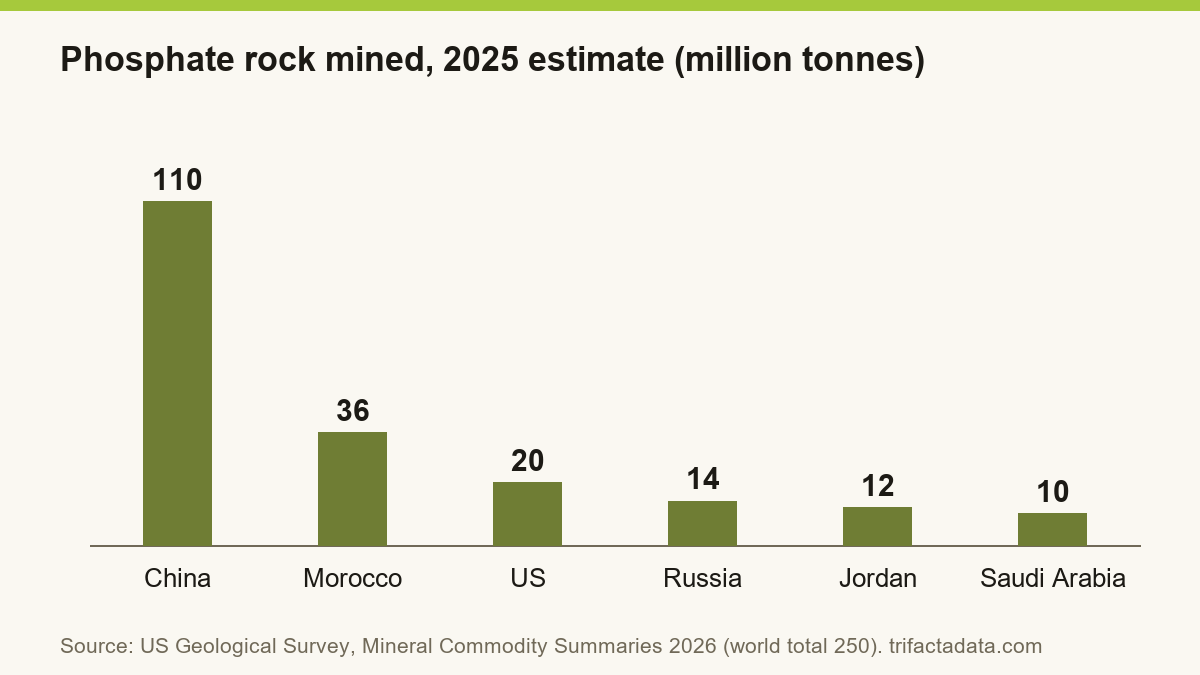
The three main nutrients come from very different places. According to the US Geological Survey, the world mined an estimated 250 million tonnes of phosphate rock in 2025, 44% of it in China and 14% in Morocco, which also holds about 68% of the world's reserves (50 billion of 73 billion tonnes, calculated). Potash output was an estimated 49 million tonnes of K2O, with Canada, Russia and Belarus together producing about 63%. Ammonia, the base of nitrogen fertilizer, is made in many countries, with China producing about 31% of the 160 million tonnes of nitrogen content in 2025.
| Material, 2025 estimate | World output | Leading producers (share calculated) |
|---|---|---|
| Potash (K2O) | 49 million tonnes | Canada 15 (31%); Russia 10 (20%); China 6.3 (13%); Belarus 6 (12%) |
| Phosphate rock | 250 million tonnes | China 110 (44%); Morocco 36 (14%); United States 20 (8%); Russia 14 (6%) |
| Ammonia (nitrogen content) | 160 million tonnes | China 49 (31%); India 15 (9%); Russia 15 (9%); United States 14 (9%) |
| Sulfur (all forms) | 84 million tonnes | China 19; Russia 7.5; Saudi Arabia 7.2; United States 8.1 (2024); United Arab Emirates 6.3 |
How much the world uses
Data from the Food and Agriculture Organization (FAOSTAT) show that world agricultural use of fertilizer in 2024 was 115.2 million tonnes of nitrogen, 43.9 million of phosphate (P2O5) and 38.3 million of potash (K2O), so nitrogen is about 58% of the nutrient tonnage (calculated). The USGS counts nutrients contained in fertilizers slightly differently and puts phosphate use at 47.1 million tonnes in 2024 and 47.8 million in 2025, and potash use at 40.6 and 41.6 million, projecting 51.5 million and 45.3 million by 2029.
What is still uncertain
First, 2026 is not over: the full-year averages will depend on the fourth quarter, so the comparison with the April forecast is for three quarters only. Second, the World Bank said in April and May that risks were tilted to the upside and that fertilizer affordability for farmers had fallen to its weakest since mid-2022; the October prices for urea are lower, but this page has no newer affordability measure. Third, this page does not give a share of world fertilizer trade that passes through the Strait of Hormuz, because the published estimates differ by source and by what they count, and the originals were not available to check. Finally, the figures are wholesale benchmark prices at particular ports, not the prices farmers pay.
Frequently asked questions
What did the World Bank forecast for fertilizer prices in 2026?
In April 2026 it forecast that its fertilizer price index would average 181.3 in 2026, up 30.7% on 2025, with urea averaging USD 675 a tonne, DAP USD 725, potassium chloride USD 390 and phosphate rock USD 160.
What happened to urea prices in 2026?
Urea averaged USD 537.7 a tonne in the first quarter, USD 693.5 in the second and USD 399.2 in the third, according to the World Bank's October 2026 Pink Sheet, and was USD 407.5 in September.
Why did phosphate prices keep rising?
The World Bank's May blog pointed to higher sulfur prices, Chinese moves to tighten exports and accelerated maintenance at Morocco's OCP. It did not say why urea fell back. DAP averaged USD 791.8 a tonne in the third quarter.
Which countries supply the most phosphate, potash and ammonia?
According to the US Geological Survey, China mined 110 of the world's 250 million tonnes of phosphate rock in 2025 and Morocco holds about 68% of reserves; Canada produced 15 of 49 million tonnes of potash; and China made about 31% of the world's ammonia.
How much fertilizer does the world use?
FAOSTAT puts world agricultural use in 2024 at 115.2 million tonnes of nitrogen, 43.9 million tonnes of phosphate (P2O5) and 38.3 million tonnes of potash (K2O).
Sources
- World Bank, Commodity Markets Outlook, April 2026: forecast table
- World Bank, Commodity Price Data (The Pink Sheet), October 2026
- World Bank Data Blog, 'Fertilizer prices surge as Strait of Hormuz disruptions tighten supplies', 14 May 2026
- US Geological Survey, Mineral Commodity Summaries 2026: Phosphate rock
- US Geological Survey, Mineral Commodity Summaries 2026: Potash
- US Geological Survey, Mineral Commodity Summaries 2026: Nitrogen (fixed), ammonia
- US Geological Survey, Mineral Commodity Summaries 2026: Sulfur
- FAOSTAT, Inputs: Fertilizers by nutrient (bulk file, downloaded 13 October 2026)
Related reports
This page is market information, not investment or agronomic advice. Figures are quoted from the sources linked above; forecasts are labelled as such, and averages marked as calculated are simple averages worked out by Trifacta Data.