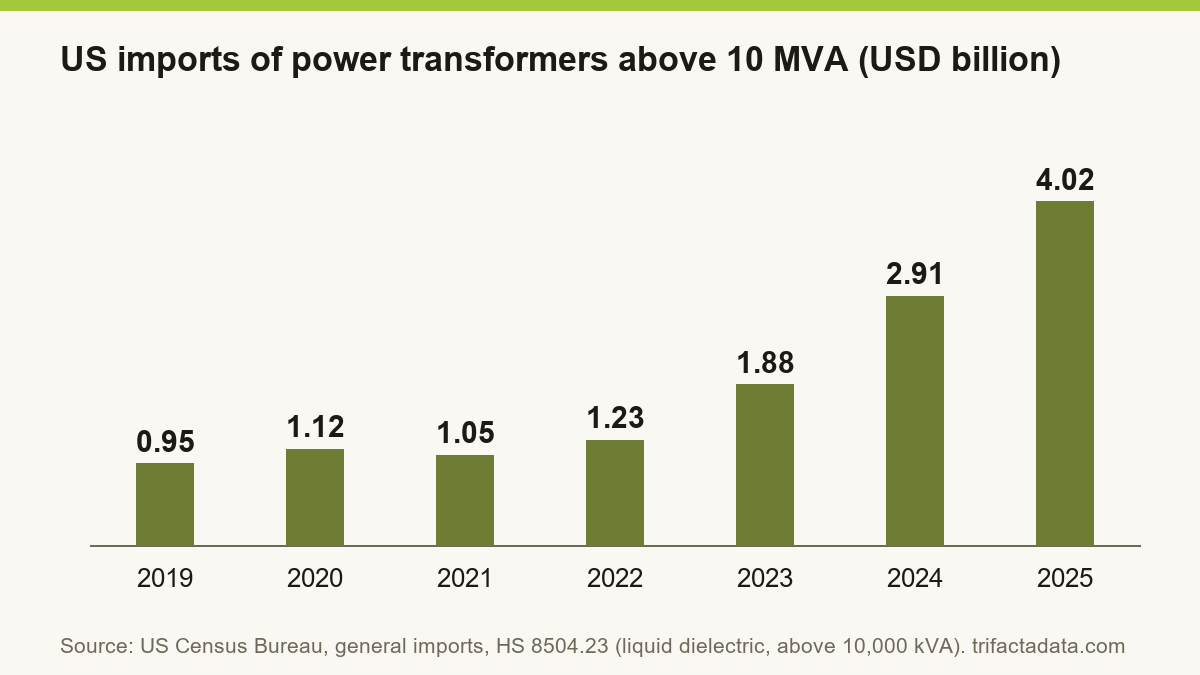
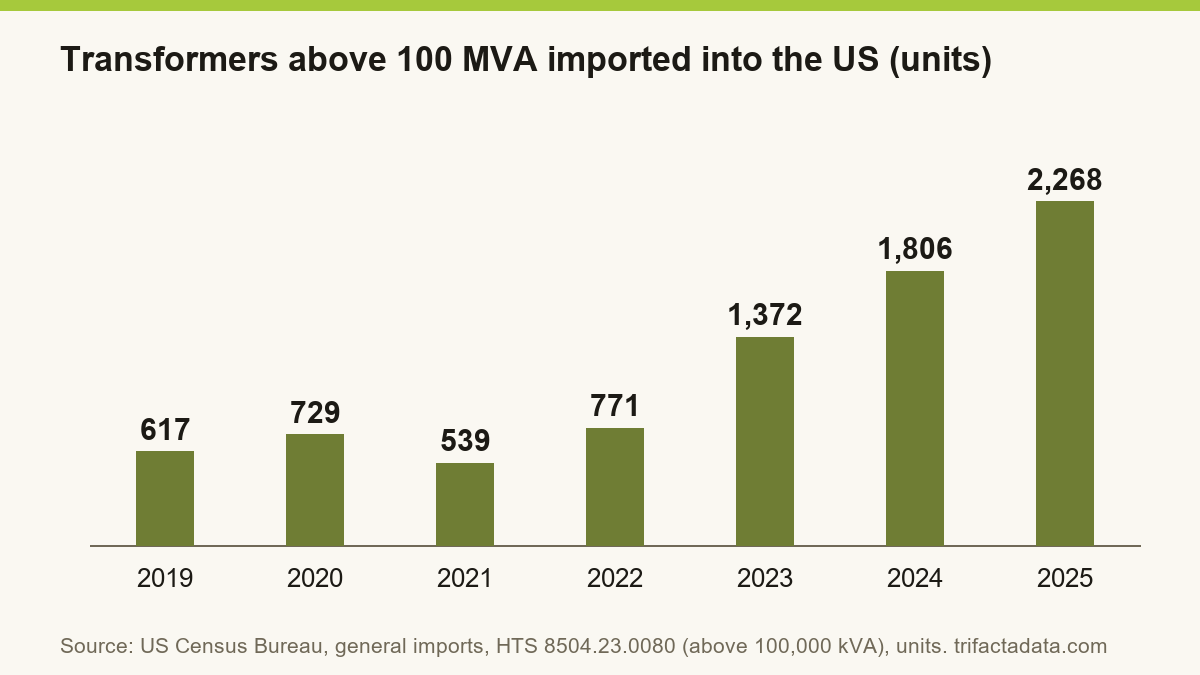
The United States imported USD 4.02 billion of liquid-filled power transformers above 10 MVA in 2025, more than four times the USD 0.95 billion of 2019, according to US Census Bureau trade data. In the size the Department of Energy calls a large power transformer, above 100 MVA, imports rose from 617 units in 2019 to 2,268 in 2025, and the first nine months of 2026 are higher again. This page shows how the imports grew, who supplies them, what has happened to prices and lead times, and what the data do not say. Every figure links to its source.
How much the US imports
Liquid-filled transformers above 10,000 kVA (10 MVA) are the large units that step up a power station's output for the grid and step it down again at substations. The US Census Bureau records their imports under HS code 8504.23. Its trade data show USD 952.6 million of imports in 2019, USD 1,119.9 million in 2020, USD 1,051.8 million in 2021, USD 1,225.6 million in 2022, USD 1,878.5 million in 2023, USD 2,913.8 million in 2024 and USD 4,022.4 million in 2025. From January to September 2026 imports were USD 3,351.3 million, 14.3% more than in the same months of 2025 (calculated).
The US tariff schedule splits the code by size. The largest band, above 100,000 kVA (100 MVA), matches the Department of Energy's definition of a large power transformer, and it accounts for most of the value: USD 2,774.3 million of the USD 4,022.4 million in 2025. The Census also counts units in that band: 617 in 2019, 729 in 2020, 539 in 2021, 771 in 2022, 1,372 in 2023, 1,806 in 2024 and 2,268 in 2025. From January to September 2026 the count was 2,087, against 1,670 in the same months of 2025, an increase of 25.0% (calculated).
| US imports, HS 8504.23 | 2019 | 2023 | 2024 | 2025 | Jan-Sep 2025 | Jan-Sep 2026 |
|---|---|---|---|---|---|---|
| 10 to 60 MVA, USD million | 253.0 | 430.4 | 587.7 | 933.3 | 668.1 | 583.9 |
| 60 to 100 MVA, USD million | 79.8 | 147.5 | 251.7 | 314.8 | 190.2 | 339.6 |
| Above 100 MVA, USD million | 619.7 | 1,300.6 | 2,074.4 | 2,774.3 | 2,074.1 | 2,427.8 |
| Above 100 MVA, units | 617 | 1,372 | 1,806 | 2,268 | 1,670 | 2,087 |
| All above 10 MVA, USD million | 952.6 | 1,878.5 | 2,913.8 | 4,022.4 | 2,932.4 | 3,351.3 |
The 2019 count is the same one the US Department of Commerce used in its estimate, quoted in the Department of Energy's Large Power Transformer Resilience Report to Congress (July 2024), that 617 units (82%) of the large power transformers used in the United States in 2019 were imported and 137 (18%) were made at home. The same report put the maximum capacity of US makers at about 343 large units a year, running at about 40% of capacity at the time. On those figures, 2025's imports alone were more than six times what US plants could make in 2019 (calculated); newer capacity figures were not published in the sources we read.
Smaller transformers tell a different story
The smaller sizes grew fast too, but they are slowing. Imports of transformers of 650 to 10,000 kVA (HS 8504.22) rose from USD 278.5 million in 2019 to USD 2,110.1 million in 2025, and were USD 1,597.8 million in January to September 2026, 1.8% more than a year earlier. Imports of the smallest liquid-filled units, up to 650 kVA (HS 8504.21, mostly distribution transformers), peaked at USD 1,571.5 million in 2024, fell to USD 1,358.8 million in 2025 and were 15.0% lower in January to September 2026 (all changes calculated). The large units above 10 MVA are the only band still growing at a double-digit rate.
Who supplies them
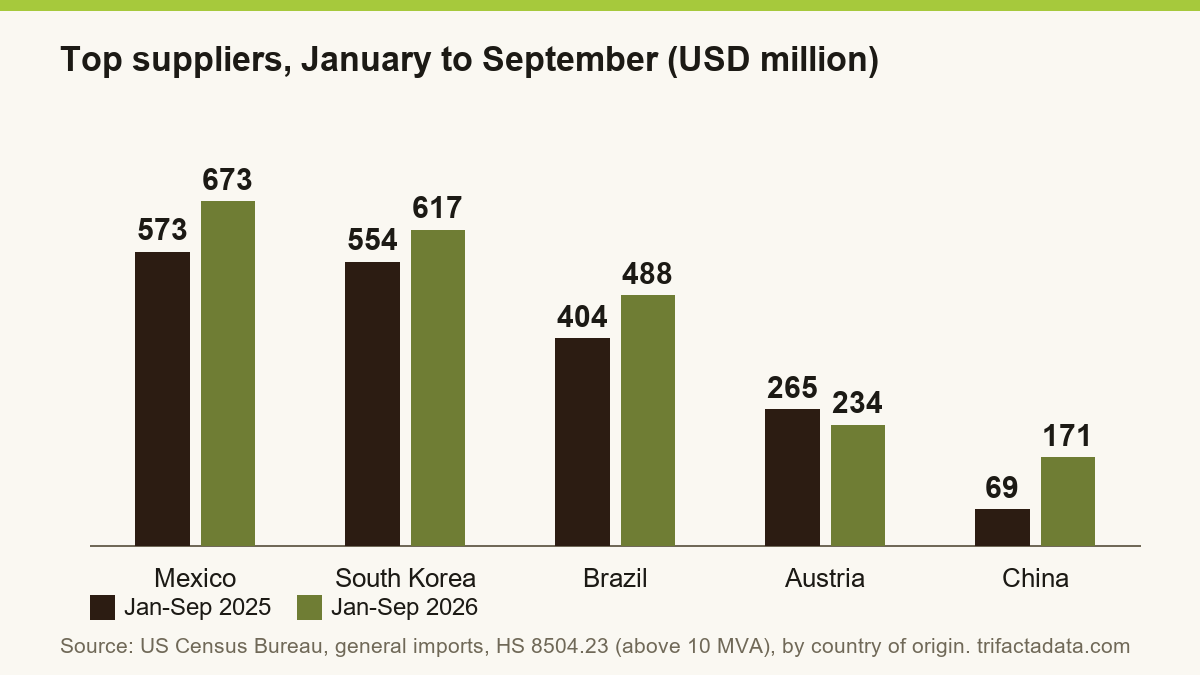
In 2025 the largest suppliers of transformers above 10 MVA were Mexico (USD 798.9 million, 19.9% of the total), South Korea (USD 725.3 million, 18.0%) and Brazil (USD 511.3 million, 12.7%), followed by Austria (9.8%), the Netherlands (6.4%), Taiwan (6.1%) and Canada (5.3%) (shares calculated). Together the first three supplied half. In 2019 the order was different: Mexico (25.4%) and Austria (22.6%) led, South Korea had 13.6% and Brazil 2.4%. Brazil's sales rose from USD 22.4 million in 2019 to USD 511.3 million in 2025. The European Union's share fell from 44.1% in 2019 to 27.2% in 2025, although its sales grew from USD 420.0 million to USD 1,094.6 million.
The first nine months of 2026 show more change. Imports from Mexico rose 17.3%, from South Korea 11.4% and from Brazil 20.9%, while those from Austria fell 11.6%, Canada 31.8% and the Netherlands 44.3%. Imports from China rose from USD 69.4 million to USD 171.2 million and from Croatia from USD 44.8 million to USD 154.6 million (all changes calculated). Customs data record where a transformer was made, not which company made it, so they do not show whether these shifts reflect new factories, new contracts or one-off deliveries.
Large transformers from South Korea are also subject to US anti-dumping duties: the Energy Department laboratory report notes that the US International Trade Commission upheld them in 2024, citing a likely recurrence of material injury to US makers if they were revoked. This page does not cover the tariffs in force on each supplier.
Prices and lead times
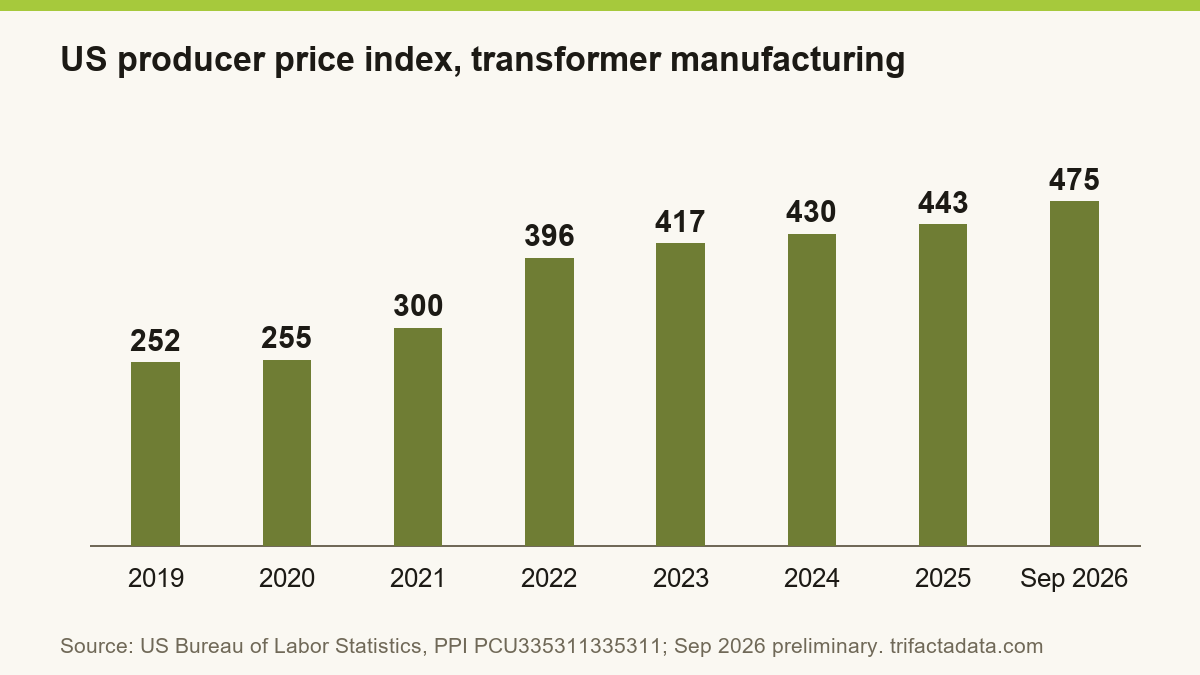
The US Bureau of Labor Statistics publishes a producer price index for power, distribution and specialty transformer manufacturing. Its annual average was 252.1 in 2019 and 255.3 in 2020, then rose to 299.6 in 2021, 396.3 in 2022, 416.6 in 2023, 429.7 in 2024 and 442.7 in 2025, 75.6% above 2019. The preliminary reading for September 2026 is 475.1, 7.8% higher than in September 2025 (changes calculated). The index covers all transformer types made in the United States, not only the large units, and it measures what US producers charge, not import prices.
Import values per unit rose less. The average customs value of a transformer above 100 MVA was about USD 1.00 million in 2019, USD 1.22 million in 2025 and USD 1.16 million in January to September 2026 (calculated). Unit values move with the mix of sizes and with how units are declared, so they are not a price index.
Lead times are the bigger problem for buyers. The Department of Energy's 2024 report said that 36-month lead times were commonly quoted for a large power transformer, with maximum lead times as long as 60 months, against less than a year before the pandemic. The May 2026 report from the Energy Department's National Laboratory of the Rockies puts the average time from order to delivery at 30 months in the first half of 2025, up from 5 to 16 months in 2010 (citing an industry consultant and the Energy Department). It also lists components with long waits: bushings take up to 130 weeks and on-load tap changers 80 to 90 weeks. The same report estimates that roughly 80% of the large power transformers used in the United States are imported.
What is still uncertain
First, customs data count transformers when they arrive, not when they are ordered or installed, so a rise in imports can reflect deliveries from orders placed two or three years earlier. Second, 2026 figures run only to September and recent months can be revised. Third, the data do not show US production in 2025 or 2026, so they cannot say whether the share of imports has risen or fallen since the 2019 estimate. Fourth, the price index covers all transformer types and the unit values depend on the size mix, so neither is a clean price for a large power transformer. Finally, this page does not cover tariffs, which can change what buyers pay for each supplier's units.
Frequently asked questions
How many large power transformers does the US import?
US Census Bureau data show 2,268 transformers above 100 MVA imported in 2025, up from 617 in 2019, and 2,087 in January to September 2026. All liquid-filled transformers above 10 MVA were worth USD 4.02 billion in 2025.
Where does the US import power transformers from?
In 2025 Mexico supplied 19.9% of US imports of transformers above 10 MVA by value, South Korea 18.0% and Brazil 12.7%, followed by Austria, the Netherlands, Taiwan and Canada (shares calculated from Census data).
Does the US make its own large power transformers?
Some. A US Department of Commerce estimate quoted by the Department of Energy found that 137 of the 754 large power transformers used in 2019 (18%) were made in the United States and 617 (82%) were imported. A May 2026 Energy Department laboratory report estimates that roughly 80% are imported.
How long does it take to get a large power transformer?
The Energy Department's 2024 report said 36-month lead times were commonly quoted, with some as long as 60 months. A May 2026 Energy Department laboratory report puts the average at 30 months in the first half of 2025, against 5 to 16 months in 2010.
Have transformer prices gone up?
The US producer price index for transformer manufacturing averaged 442.7 in 2025, 75.6% above 2019's 252.1, and was 475.1 (preliminary) in September 2026, 7.8% higher than a year earlier.
Sources
- US Census Bureau, international trade API: general imports by HS code and country, HS 8504.21, 8504.22 and 8504.23 (6-digit) and 8504.23.0041, .0045 and .0080 (10-digit), 2019 and 2022 to September 2026 (read 12 November 2026)
- US Bureau of Labor Statistics, producer price index PCU335311335311, power, distribution and specialty transformer manufacturing (read 12 November 2026)
- US Department of Energy, Large Power Transformer Resilience Report to Congress, July 2024
- National Laboratory of the Rockies (US Department of Energy), Large Power Transformer Supply Chain Gap Analysis and Domestic Content Strategies for Hydropower Rehabilitation: Supplemental Report, NLR/TP-5700-96742, May 2026
Related reports
This page is market information, not investment advice. Trade figures are US Census Bureau general imports at customs value (before freight and duty), read from the Census international trade API on 12 November 2026; 2026 data run to September, and recent months can be revised. HS 8504.23 covers liquid dielectric transformers above 10,000 kVA (10 MVA); the US code 8504.23.0080 covers those above 100,000 kVA (100 MVA). Units are the counts declared at import. Shares, changes and averages marked as calculated are worked out by Trifacta Data.